Snapback ES — Weekly roundup (2026-06-05)
Trades: 3 (2W / 1L)
Hit rate: 67%
Net: +6.8 pts
PF: 1.43
Max DD from peak: 15.8 pts
This past week the Snapback stayed patient, taking just three trades across seven sessions as conditions rarely pushed price far enough from the value line to qualify. Two of those three faded the stretch back toward value and held,…
View on Telegram ›PUBLIC TRACK RECORD · ISSUE 016UPDATED 2026-06-06 00:58
Snapback
An algorithmic futures program trading a mean-reversion strategy across multiple instruments — publishing every trade, winners and losers alike. Walk-forward validated, volatility-anchored, retrospective only.
Week ending 2026-06-05
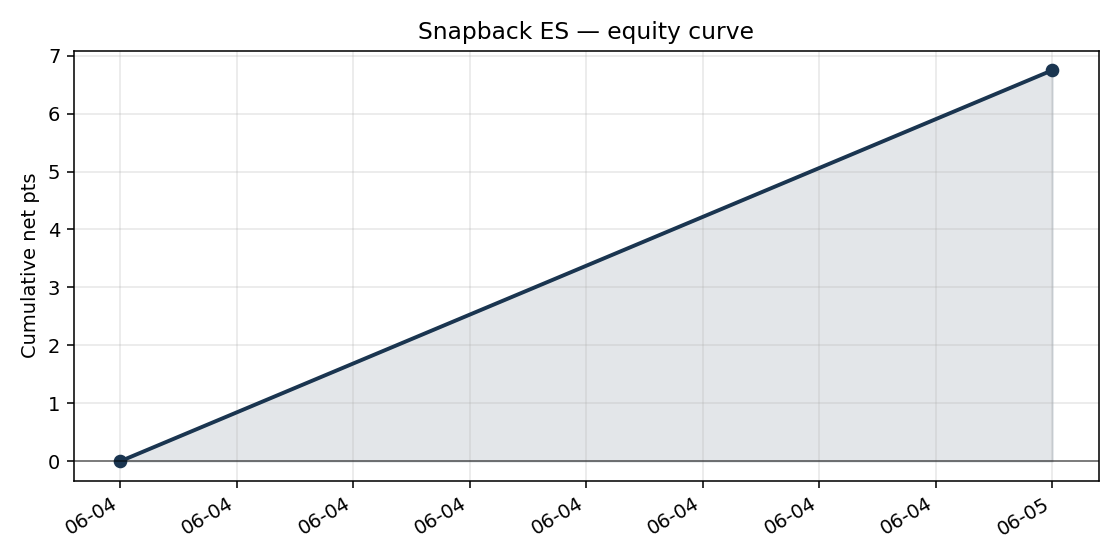
This past week the Snapback stayed patient, taking just three trades across seven sessions as conditions rarely pushed price far enough from the value line to qualify. Two of those three faded the stretch back toward value and held, while one was stopped out, leaving the week at a 67% hit rate and a net gain of 6.8 points. It was a grind rather than a blowout, with a profit factor of 1.43 and a shallow drawdown of about 16 points from the week's peak. Low trade count is normal for a strategy that waits for genuine capitulation rather than forcing setups, and a quiet green week is a perfectly acceptable outcome.
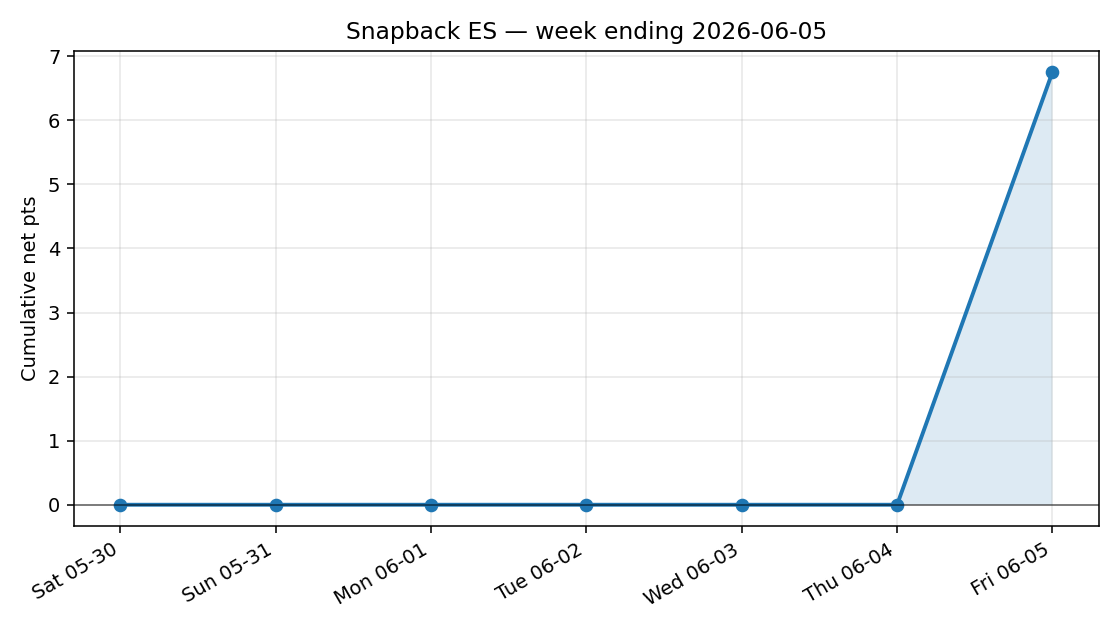
Cumulative net pts, week ending 2026-06-05
Latest posts
Every post we publish, mirrored here from our Telegram channel — refreshed each time we post. Follow live ›
Snapback NQ — Weekly roundup (2026-06-05)
Trades: 3 (3W / 0L)
Hit rate: 100%
Net: +154.2 pts
PF: ∞
Max DD from peak: 0.0 pts
The Snapback had a clean week on /NQ, closing the period ending June 5 with three trades and three winners for a net gain of about 154 points. Each setup faded an extreme stretch and saw price work back toward the value line, with no…
View on Telegram ›Snapback ES — Setup of the day (2026-06-05)
A long fade, entered @ 7397.50 at 15:41 ET.
Exited @ 7414.75 at 15:50 ET after a 9-minute hold.
Result: winner, +17.2 pts.
Why this one: largest absolute net move of the day. We publish both winners and losers — the losers are where the mechanics show most clearly.
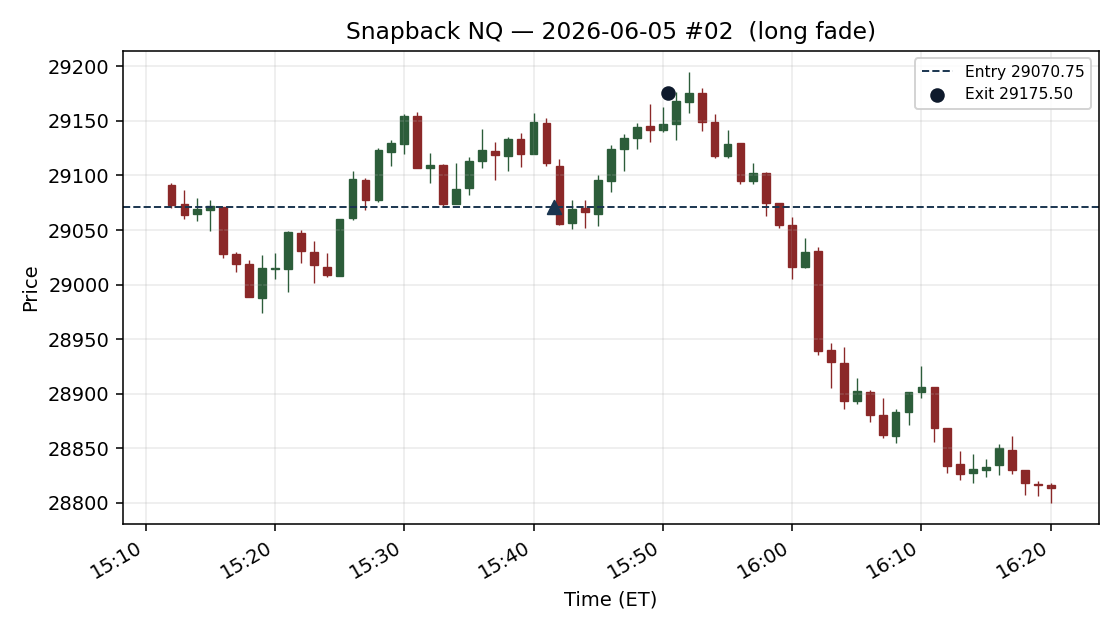
View on Telegram ›Snapback NQ — Setup of the day (2026-06-05)
A long fade, entered @ 29070.75 at 15:41 ET.
Exited @ 29175.50 at 15:50 ET after a 9-minute hold.
Result: winner, +104.8 pts.
Why this one: largest absolute net move of the day. We publish both winners and losers — the losers are where the mechanics show most clearly.
View on Telegram ›Snapback ES — 2026-06-05
Trades: 3 (2W / 1L)
Hit rate: 67%
Net: +6.8 pts
PF: 1.43
Track record updated. Per-trade detail on the site.
View on Telegram ›Snapback NQ — 2026-06-05
Trades: 3 (3W / 0L)
Hit rate: 100%
Net: +154.2 pts
PF: ∞ (no losing trades)
Track record updated. Per-trade detail on the site.
View on Telegram ›Combined record
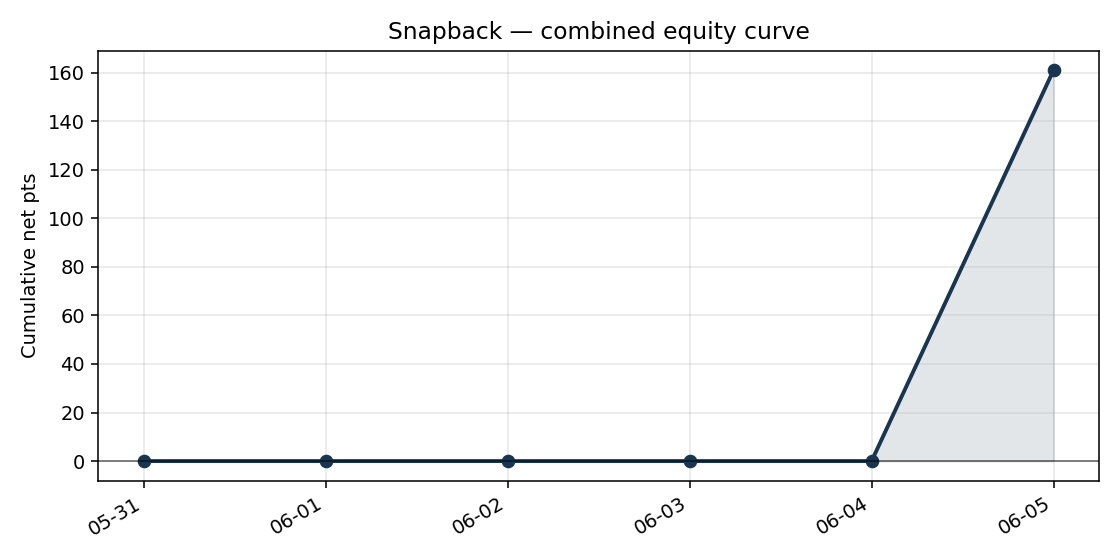
Cumulative net pts — +161.00 through 2026-06-05
Max drawdown: 0.00 pts
Trade-by-trade record
| Session | Instrument | Trades | Net pts |
|---|---|---|---|
| 2026-06-05 | ES | 3 | +6.75 |
| 2026-06-05 | NQ | 3 | +154.25 |
| 2026-06-04 | ES | 0 | — |
| 2026-06-04 | NQ | 0 | — |
| 2026-06-03 | NQ | 0 | — |
| 2026-06-02 | NQ | 0 | — |
| 2026-06-01 | NQ | 0 | — |
| 2026-05-31 | NQ | 0 | — |
Every published number is verified by a sha8 hash of the source data — see the colophon.
Snapback NQ
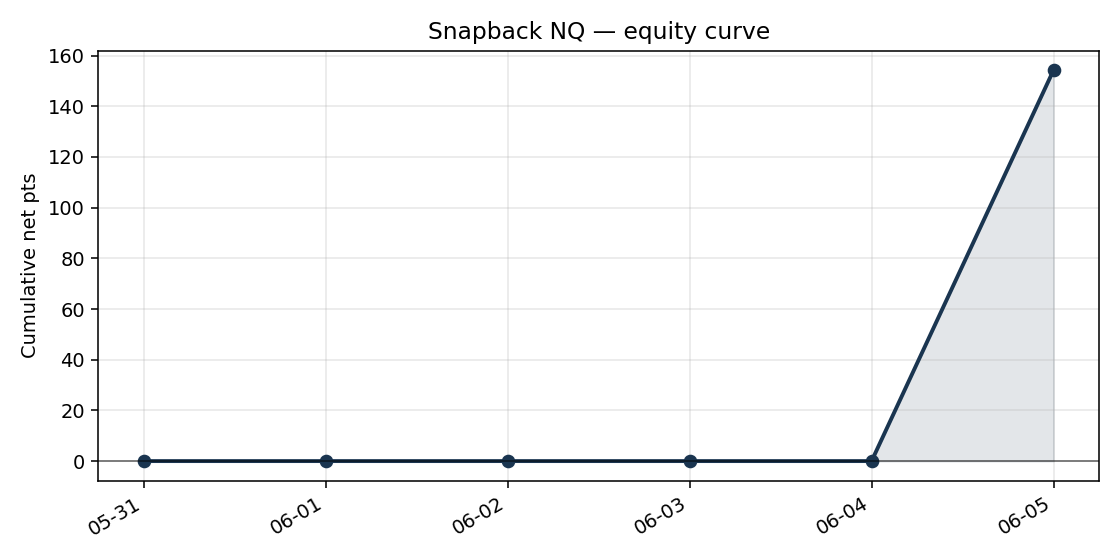
Cumulative net pts — +154.25 through 2026-06-05
Max drawdown: 0.00 pts
Trade-by-trade record
| Session | Trades | Net pts |
|---|---|---|
| 2026-06-05 | 3 | +154.25 |
| 2026-06-04 | 0 | — |
| 2026-06-03 | 0 | — |
| 2026-06-02 | 0 | — |
| 2026-06-01 | 0 | — |
| 2026-05-31 | 0 | — |
Every published number is verified by a sha8 hash of the source data — see the colophon.
Setups, annotated
Snapback NQ — Setup of the day (2026-06-05)
A long fade, entered @ 29070.75 at 15:41 ET. Exited @ 29175.50 at 15:50 ET after a 9-minute hold. Result: winner, +104.8 pts.
Why this one: largest absolute net move of the day. We publish both winners and losers — the losers are where the mechanics show most clearly.
verified: 623c6ba9
— Educational content, not investment advice. Past performance does not predict future results. Futures trading carries substantial risk. We publish a complete record of every trade, including losses.
2026-06-05
How the strategy has evolved
Generic-language record of changes made to the strategy. No parameters or thresholds — those stay in the private research log.
- 2026-06-05Corrected a live protective-stop setting on one strategy so it matches its validated backtest specification.
- 2026-05-31Rotated the live intraday strategy to a newly validated setup running at minimum size; the prior setup moved to observation.
Snapback ES
Cumulative net pts — +6.75 through 2026-06-05
Max drawdown: 0.00 pts
Trade-by-trade record
| Session | Trades | Net pts |
|---|---|---|
| 2026-06-05 | 3 | +6.75 |
| 2026-06-04 | 0 | — |
Every published number is verified by a sha8 hash of the source data — see the colophon.
Setups, annotated
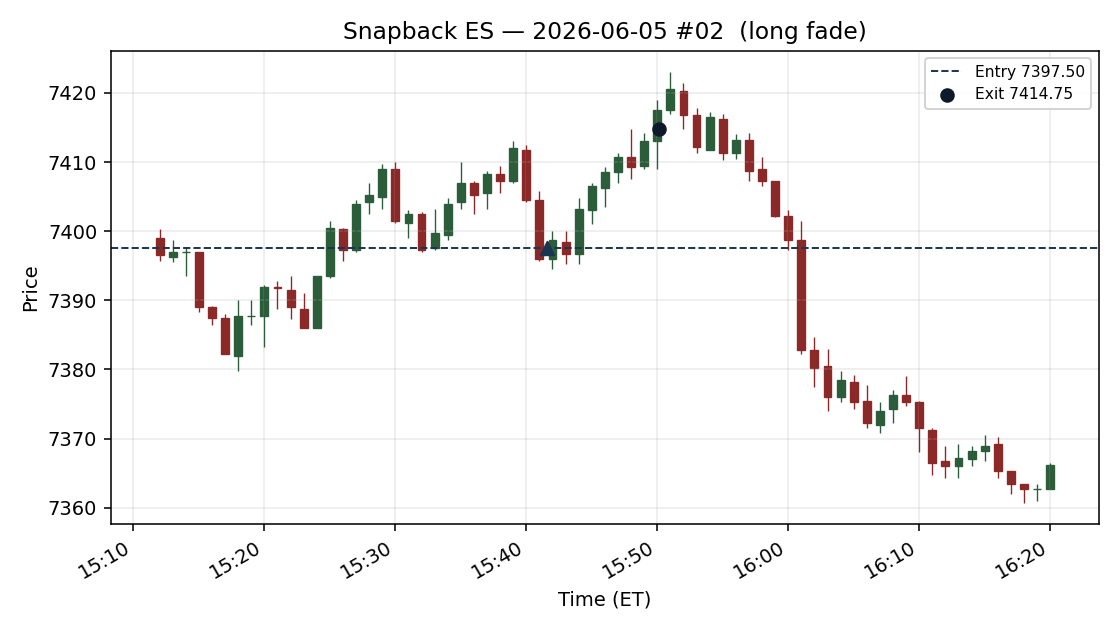
Snapback ES — Setup of the day (2026-06-05)
A long fade, entered @ 7397.50 at 15:41 ET. Exited @ 7414.75 at 15:50 ET after a 9-minute hold. Result: winner, +17.2 pts.
Why this one: largest absolute net move of the day. We publish both winners and losers — the losers are where the mechanics show most clearly.
verified: e7c29764
— Educational content, not investment advice. Past performance does not predict future results. Futures trading carries substantial risk. We publish a complete record of every trade, including losses.
2026-06-05
On methodology
- Our Vocabulary
Read
You'll see a handful of specific terms used here over and over. They're chosen to be precise about what we can observe, and quiet about what we can't.
We use language grounded in market mechanics — auctions, order flow, volatility, mean reversion. We don't use language that implies we know what large institutions are "doing" or "thinking." We don't. Nobody does. What we can observe is where price has travelled relative to where it's been transacting, and how that gap behaves afterward.
The core idea is the Snapback — when price stretches unusually far from value and is then reclaimed. The supporting terms all describe pieces of that:
- The value line — a moving, volatility-aware sense of where the auction has recently been doing business.
- The stretch — how far price has pulled away from the value line, measured in units of current volatility.
- Capitulation — the fast, one-sided selling that produces an extreme downside stretch.
- Confluence — several independent measures agreeing that a move looks exhausted.
- The fade — taking the side opposite the overshoot, betting on the reclaim.
We avoid words like smart money, manipulation, and killzone. They sound authoritative but they ascribe motive to anonymous prints. We'd rather be precise about what we can see.
One more thing we're deliberate about: we publish the trades, not the recipe. You'll get every entry, every exit, every result, and the reasoning style behind them — but not the specific indicators, counts, or thresholds that generate a signal. The track record is open. The engine stays private. Both can be true at once.
- The Snapback
Read
Price doesn't move in straight lines, and it doesn't stay glued to fair value either. Every so often it travels much further from where the auction has been doing business than the flow behind the move can justify. That overshoot — the stretch — is unstable. More often than a coin flip, it gets reclaimed.
The reclaim is the Snapback, and it's the only thing we trade.
That distinction matters. We are not trying to catch the overshoot — the fast move that creates the stretch. Catching a falling knife is how accounts die. We wait until price is already extended, the move that drove it there is showing signs of exhaustion, and the conditions that historically precede a reclaim are present. Then we take the side opposite the stretch and hold for the reversion toward value.
It isn't magic, and it isn't a prediction. It's a statistical tendency: extreme, exhausted stretches in index futures revert toward value more often than they extend, and when they do revert they tend to do it quickly. That asymmetry — frequent quick reclaims, occasional clean stops — is the whole edge.
Most of the time there's no Snapback to trade. Price sits near value, or it's stretched but not exhausted, or the conditions don't line up. The strategy waits. A normal session produces a handful of qualifying setups at most, and many sessions produce none. Patience isn't a virtue we're advertising — it's structurally what the strategy does, because the edge only exists at the extremes.
Everything else on this page is a detail of how we decide a stretch is worth fading. This is the core: stretch, exhaustion, reclaim.
- Why Markets Revert
Read
Markets are auctions. An auction's job is to find the price where buyers and sellers transact in size. When price rips away from that zone fast, it leaves the auction's real business behind — and several real forces tend to pull it back.
Resting demand below the move. A fast drop runs past the prices where patient buyers were willing to participate. Those bids didn't get filled on the way down; many are still there. The further price overshoots, the more unfilled demand it leaves stacked beneath it.
Volatility mean reversion. A violent one-directional move carries information, but it also carries emotion and forced flow. Once the forced flow is done, price has usually overshot fair value, and a broad set of participants fade extension as a matter of course. Extremes don't persist; that's almost the definition of an extreme.
Exhaustion. A move needs fresh participants to continue. A capitulation is, by its nature, participants leaving — sellers hitting bids until there are no more eager sellers. When the last forced seller is done, there's nothing left to push price lower, and the path of least resistance flips.
Not every overshoot reverts. Some are the front edge of a genuine regime change and keep going — those are the trades that hit our stop. We're not trying to catch every reclaim. We're trying to act only when the reversion is statistically likely and the move that caused the stretch looks spent.
Price returns toward value because that's where the auction's unfinished business sits. Our job is to tell the reclaims that are coming from the overshoots that aren't — and to be honest that we'll never get that call right every time.
- The Value Line
Read
Everything we do is measured against a sense of fair value — where the auction has recently been doing its business. We call it the value line.
It isn't a single static price. It moves, and it adapts to volatility: in a fast tape it sits looser, in a quiet tape it tracks tighter. Think of it less as a precise level and more as a centre of gravity that price oscillates around — pulling away, snapping back, drifting through, pulling away again.
Why anchor to a moving reference instead of a fixed level like a prior high or a round number? Because fixed levels are arbitrary with respect to how far price has travelled. The question that matters for a reversion trade isn't "did price reach a specific number" — it's "how unusually far is price from where it's actually been trading, right now, given how volatile right now is." A moving, volatility-aware reference answers that. A static line can't.
When price is near the value line, there is no trade. Nothing is stretched; nothing is likely to revert. The relationship is neutral. The strategy is dormant for the large majority of every session precisely because price spends most of its time near value.
The setups live at the other extreme — when price has pulled far enough from the value line that the gap itself becomes the signal worth investigating.
We don't publish how the value line is computed. That's part of the engine, and the engine stays private. What matters for understanding the track record is the idea: we trade the relationship between price and value, not a chart pattern and not a fixed price.
- Measuring the Stretch
Read
The stretch is how far price has pulled away from the value line. But raw distance in points is meaningless on its own.
A 40-point gap from value in a sleepy overnight tape is enormous — price almost never travels that far when volatility is low, so a 40-point stretch there is a genuine extreme. The same 40 points during a violent, high-volatility session is barely a wiggle; price covers that range in a single bar and keeps going. Treating those two as the same setup would be a category error.
So we measure the stretch in units of current volatility, not points. The question is always relative: how unusual is this distance, given how much price has been moving lately? That normalisation is what lets one strategy operate across calm nights and frantic afternoons without re-tuning by hand.
And we don't act on mild stretch. Small pulls away from value are the most common thing price does, and they resolve unpredictably — sometimes reverting, sometimes continuing, with no usable edge. The reversion tendency only becomes strong enough to trade at the extremes: when price is stretched far enough that the move is statistically unusual and the flow behind it is likely exhausted.
This is the single biggest filter in the strategy, and it's why it trades rarely. Most candidate moments are mild stretches that never qualify. We let them go. The discipline of waiting for an extreme — and only an extreme — is doing more work than any other decision in the system.
We don't publish where the line between "mild" and "extreme" sits. That threshold is part of the engine. The principle is what's worth understanding: extreme, volatility-normalised stretch is the precondition for everything else.
- Why We Wait for Confluence
Read
Any single way of measuring "this move looks exhausted" fires too often and is wrong too often to trade on its own. Every oscillator, every extension measure, every momentum read has the same problem: in isolation it flags far more reversals than actually happen, because markets spend a lot of time looking exhausted right before they keep going.
So we don't act on any one of them. We require confluence — several independent measures, each looking at the question from a different angle, agreeing at the same moment that the move is spent.
The value of agreement is that the measures are independent. Each one is noisy, but their errors aren't perfectly correlated. When measures that usually disagree all line up pointing the same way, the situation is genuinely unusual, and the historical reversion rate at those moments is materially higher than for any single trigger alone. Confluence isn't about stacking confirmations to feel more confident — it's about waiting for the rare coincidence that actually carries information.
The cost is trade count. Demanding agreement throws away the large majority of moments where only one or two measures fire. That's intended. We'd rather take far fewer trades with a real edge than many trades with a marginal one.
We don't publish which measures we use, how many must agree, or the thresholds. That's the core of the engine, and naming it would hand over the strategy. What's worth understanding is the shape of the decision: not one clever indicator, but the agreement of several plain ones at an extreme.
- Why We Only Buy
Read
Every Snapback trade is a long. We fade downside stretch — we buy capitulation — and we deliberately don't take the mirror-image trade of shorting upside stretch. If you scan the track record, you'll notice it immediately: there are no short trades. That's by design, not by accident.
The two tails of the market aren't symmetric, and pretending they are is a common way to bleed money on the short side.
Downside extremes in index futures are usually driven by forced selling — margin liquidation, stop cascades, risk-limit unwinds. Forced flow is violent but finite: it exhausts, and once it's done the reclaim tends to be fast and reliable. That's a clean reversion setup.
Upside extremes behave differently. A market that's stretched to the upside can simply keep melting up — squeezing shorts, chasing momentum — for far longer than a mean-reversion fade can survive. The same "it's overextended" logic that works on the downside gets run over on the upside, because there's no forced-buying analogue that reliably exhausts the way forced selling does.
When we tested both sides honestly, the long-only fade carried a real edge and the short side didn't. So we trade the side that pays and leave the other one alone. A strategy is defined as much by the trades it refuses as the ones it takes — and refusing the short side is one of the most important refusals this one makes.
- Risk Anchored to Volatility, Not a Point Count
Read
A fixed-point stop doesn't mean the same thing in a calm session as in a wild one. Thirty points is a near-impossible move on a quiet night and a routine wiggle on a violent afternoon. So we don't use fixed-point stops.
Risk on every trade is scaled to current volatility. The stop sits far enough from entry that ordinary back-and-forth won't touch it, and close enough that being hit actually means something. In a quiet tape the stop is tight in points; in a fast tape it's wide in points — but in volatility units it's the same distance every time. That consistency is the point.
What the stop means is fixed even though its point value isn't: the reversion thesis was wrong. We entered a fade betting an exhausted overshoot would be reclaimed. If price instead keeps pushing against us by more than normal volatility allows, the move wasn't exhausted — it was a trend, and we misread it. There's no story to tell ourselves at that point. We're out.
Two consequences fall out of anchoring risk this way. Setups that occur in extreme-volatility conditions automatically carry wider point-risk, which feeds into whether they're worth taking at all. And setups in calm conditions carry tight point-risk, so a small adverse move resolves them quickly rather than bleeding.
We publish the actual risk in points on every trade we post, so you can see what we were wagering. We don't publish the volatility multiple behind it — that's part of the engine. The principle is the part that generalises: a stop should mean "I was wrong," and the only way to keep that meaning constant across regimes is to anchor it to volatility.
- Why We Run Nearly 24 Hours
Read
Most retail trading education centres on US cash hours, because that's when most discretionary traders are awake and their preferred patterns feel cleanest — high volume, narrow spreads, a dense book.
But the Snapback mechanism doesn't care what time it is. The thing that creates a setup — price stretching far from value, the move exhausting, the reclaim following — happens in every session that trades. /NQ runs nearly continuously, Sunday afternoon through Friday afternoon US time, and extreme stretches form throughout. Some of the cleanest capitulation-and-reclaim setups happen in the overnight session, when a thin book lets price overshoot hard and then snap back just as hard.
So we run continuously rather than restricting ourselves to cash hours.
What changes session to session is liquidity texture. Overnight volume is thinner, so price reaches extreme stretches more often — but the reclaims can be choppier and less orderly. The US session has the densest book and the most reliable follow-through but produces fewer genuine extremes. Neither is "better." They're different regimes.
The strategy adapts mechanically rather than through session rules. Because risk is scaled to current volatility, the same setup gets wider point-risk overnight and tighter point-risk midday, automatically. We don't need a clock-based filter because volatility-adaptive risk already absorbs the regime shift.
There are a few specific calendar windows we do sit out, for reasons covered separately — scheduled high-impact events, contract rollover, data gaps, and the session cohorts where the historical edge simply wasn't there. But those are targeted exclusions, not a blanket "only trade the day session" rule. The default is: if /NQ is trading and a real extreme appears, we're watching.
- Walk-Forward, Not Hindsight
Read
Naive backtest: pick the parameters that look best across all of history, then quote the resulting profit factor.
The problem is that those parameters were chosen with knowledge of the future. You picked them because you already saw what happened. The strategy looks clean because hindsight is doing the work, not the strategy.
Walk-forward testing fixes that. The rule is simple: at every point in time, the strategy may only use information from before that point. You fit on a window of past data, test on the next chunk forward, slide the window, and repeat. The reported result is a stitched-together series of out-of-sample decisions — decisions made without knowing what came next.
The numbers always shrink when you do this honestly. A naive, hindsight-fitted profit factor can be wildly inflated; the walk-forward number is what a version of the strategy that didn't get to peek would actually have produced. On this strategy, as on every honest one, the walk-forward figure came in meaningfully below the naive one. That haircut is the part most published track records quietly omit.
If you ever see a strategy quoted with a single profit factor, no out-of-sample window, and no parameter-stability test, assume the honest number is materially lower — sometimes there's nothing left after the haircut, sometimes there is.
We publish the kind of number a strategy that didn't know the future would have produced, because that's the only number that means anything going forward. And separately, we publish the live results in real time — the genuine out-of-sample test that no backtest can fake. When live and walk-forward diverge, that gap is information, and we say so.
- Why We Publish the Misses
Read
Most published track records are highlight reels. Wins shown, losses skipped, drawdowns flattened in the chart, bad weeks waved away.
We publish the misses on purpose:
- The day the strategy took several fades and most of them stopped out.
- The capitulation that looked textbook and just kept falling.
- The weeks where the drawdown felt worse than the headline number suggested.
- The trades where a reclaim was obviously coming to the human eye and the system sat on its hands — or where the system fired and the human would have passed.
Three reasons.
One — survivorship bias is the default failure mode of trading content. If you only ever see wins, you calibrate to a fictional version of the strategy, size up at exactly the wrong moment, and then a normal losing streak feels like a catastrophe.
Two — knowing what failure looks like is part of the edge. A real strategy fails in characteristic ways. For a mean-reversion fade, the characteristic failure is obvious: the overshoot you faded wasn't exhausted, and it became a trend. If you can recognise that failure mode while it's happening, you'll manage risk differently than if every loss feels like a betrayal.
Three — it keeps us honest. Publishing every result, timestamped on a permanent page, makes quietly tweaking parameters after a bad week much harder to hide. The receipts are public.
A track record that only shows wins is selling a story. One that publishes its full distribution — including the ugly stretches a reversion strategy inevitably goes through — is showing you a process. We're after the second.
- Reading the Track Record
Read
We publish per-trade, daily, and weekly. Numbers without context are noise — here's how to read ours.
Per-trade shows: direction (always a long fade), entry, exit, the risk we were taking in points, and the result as an R-multiple. R is the trade's profit or loss in units of the risk taken on it. A +2.0R win made twice what it would have lost had the stop hit. R is the apples-to-apples unit, because raw point counts vary with how wide the volatility-scaled stop was.
Daily recaps show: trade count, hit rate, net points, and the day's profit factor. Don't anchor to hit rate alone. A reversion strategy can run a high hit rate with modest winners and the occasional larger loss when a fade turns into a trend — so hit rate without the win/loss sizes tells you almost nothing. Profit factor (gross gains over gross losses) is the more honest single number, and even it's noisy over one day.
Weekly roundups show: rolling profit factor, max drawdown from peak, trade count, and — most importantly — how live results compare to what the walk-forward simulation expected for the same period. That last comparison is the key signal. Sustained live underperformance versus simulation means something has drifted, and we investigate before we touch anything.
What to ignore in any single window: day-level results, week-level results, sometimes month-level. The edge emerges over hundreds of trades. Drawing conclusions from five is statistical noise, and so is celebrating a hot streak. We publish short-window numbers because they're the only honest way to keep the receipts current — and we caption them with that caveat every time.
- What We Don't Trade and Why
Read
A strategy is defined as much by what it rejects as by what it takes. The Snapback sits out far more than it acts. Some of that is the core filter — most stretches simply aren't extreme enough — but several exclusions are deliberate stand-asides:
Mild, non-extreme conditions. If price isn't stretched far enough from value, in volatility terms, there's no edge. The large majority of every session is exactly this, and the strategy is dormant through it.
Scheduled high-impact events. Around major releases — rate decisions, jobs and inflation prints — liquidity thins and outcomes go binary. A capitulation into an event isn't an exhausted move; it's a market waiting for information. We stand aside around those windows. The expectancy might still be positive, but the variance and tail risk aren't worth wearing.
Contract rollover. In the days around quarterly rollover, volume migrates between the front-month and next-quarter contracts. Volatility readings and the value line get distorted by the migration rather than by real flow. We pause and resume once the roll settles.
Data gaps. If our tick capture has a hole, the simulation can't faithfully reconstruct what happened, and a live decision based on incomplete data is a decision we can't later verify. We'd rather miss a real setup than act on phantom data.
Session cohorts where the edge wasn't there. Honest testing showed certain calendar windows where the reversion edge historically didn't hold up. We sit those out rather than forcing the strategy to trade everywhere.
If a rule rejects a setup that turns out to be a winner, that's expected — the rules are tuned for the distribution of outcomes, not any single trade. A filter that never rejects a winner isn't filtering.
- Regime Change and Robustness
Read
Markets go through regimes — stretches where volatility, correlation, and order-flow texture shift together. A strategy that's edge-positive in one regime can be edge-flat or edge-negative in another. Mean reversion is especially exposed to this: a fade strategy quietly assumes that extremes get reclaimed, and in a strong trending regime that assumption is exactly wrong.
The right defence isn't "find a strategy that works in every regime." That strategy doesn't exist. The right defence is knowing how robust your choices are across regimes, and accepting that periods of underperformance are part of the cost of admission.
We test robustness by running the strategy across multiple non-overlapping historical windows and comparing. If the best setting swings wildly between windows, the strategy is overfit — whatever value you pick will be the wrong one for the next regime. Stable settings look different: a smooth response where small changes to a parameter produce small changes in the result, with a wide plateau rather than a sharp peak. We want to be standing on a plateau, not on the edge of a cliff.
When live performance diverges from the walk-forward expectation, the first question is always regime, or bug? Regime change is rarer than people assume. Most divergence we've ever chased down turned out to be something boring — a data-pipeline gap, execution slippage, a mismatch between how the live system and the simulation handled an edge case — not the romantic "the market changed" story. We check the boring causes first, every time.
We can't tell you when the next regime shift will arrive. We can tell you the strategy's settings are robust within the regimes we've tested, and that the moment live drift exceeds our threshold, we investigate before we tweak.
- The Role of Discretion
Read
This is a systematic strategy. Entries, exits, stops, and sizing are rule-based and automated. In production the system runs bar by bar without human approval. So what's the role of discretion?
Strategy design. Choosing which mechanism to test — that exhausted downside extremes revert — which measures to combine, and which parameter spaces to explore is human judgment. The data tells you whether an idea works; it doesn't tell you which ideas to try.
Filter design. The decision to stand aside around scheduled events, contract rollover, and low-liquidity windows started as judgment calls, then got validated against data. Discretion proposed them; testing kept or killed them.
Anomaly response. When the system's behaviour diverges from expectation, a human decides whether to investigate, pause, or override. The system can't pause itself for "this looks wrong" reasons it can't formalise.
Retirement. When the walk-forward expectation degrades over a sustained period and the cause isn't a pipeline issue, a human decides whether to retrain, retire, or reframe. (We run this site precisely because we've done that before — we retired an earlier strategy and started this track record fresh when the evidence said to.)
What discretion is not: skipping a system signal because the falling knife "feels" too scary to catch. Adding a fade because a chart "looks" extreme when the measures don't agree. Tightening a stop out of nerves, or widening one out of hope. Every in-the-moment override of a systematic rule is, in expectation, a small subtraction from edge — because the rules were built to capture exactly that edge.
The discipline is asymmetric: discretion in the lab, system in the seat. The hardest part of running a mean-reversion strategy isn't designing it. It's sitting still while it buys the thing that looks scariest to buy.